


We've been doing this long enough to recognize the pattern. Every two years, like clockwork, the phone calls start picking up around September. The tone is usually the same. A client tells us they're "concerned about the election" and wants to know what we should be doing differently in their portfolio.
Our answer rarely changes. And after you see the data I'm about to walk you through, you'll understand why.
The Pattern
First Trust recently published a piece that compiled S&P 500 data going back to 1950. That's 19 midterm election cycles. The numbers tell a story that most retirees never hear on the news.
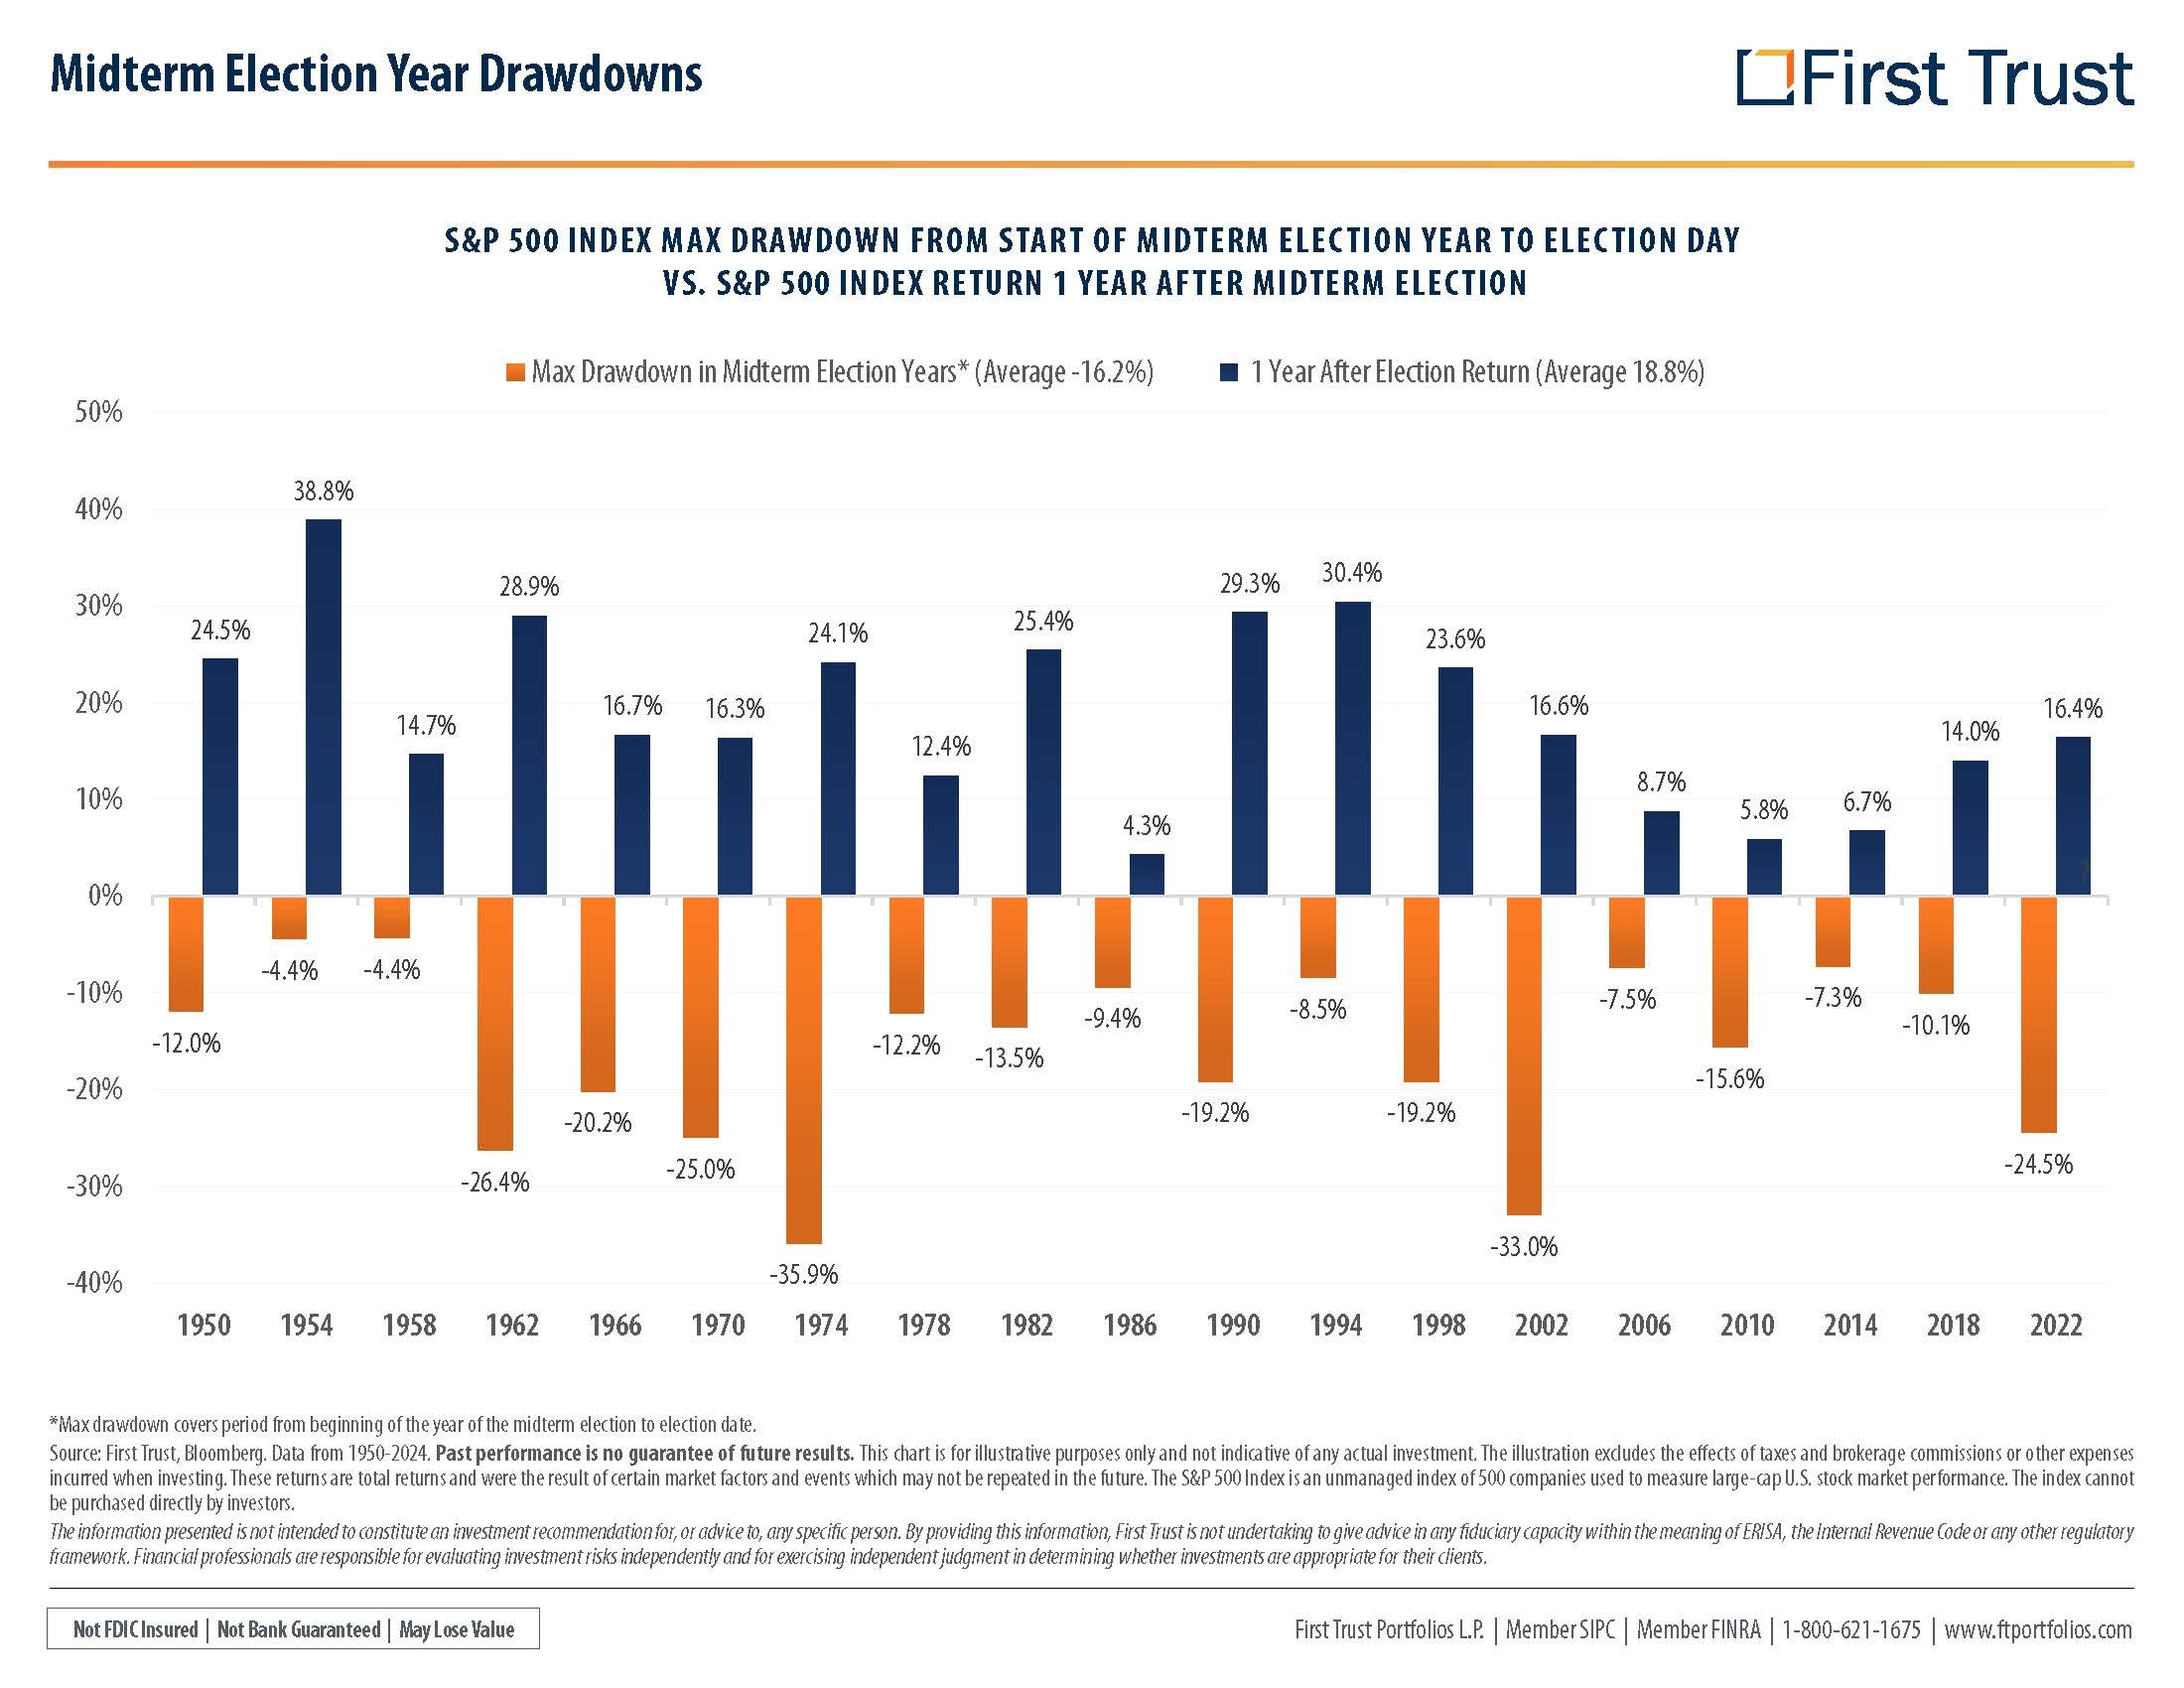
Here's the headline: midterm election years tend to be rough. The average maximum drawdown (orange bars) from the start of the year through election day is about 16%. Some years were much worse. 1974 saw a 36% drop. 2002 lost 33%. Even 2022, which feels recent, pulled back nearly 25%.
But here's where it gets interesting.
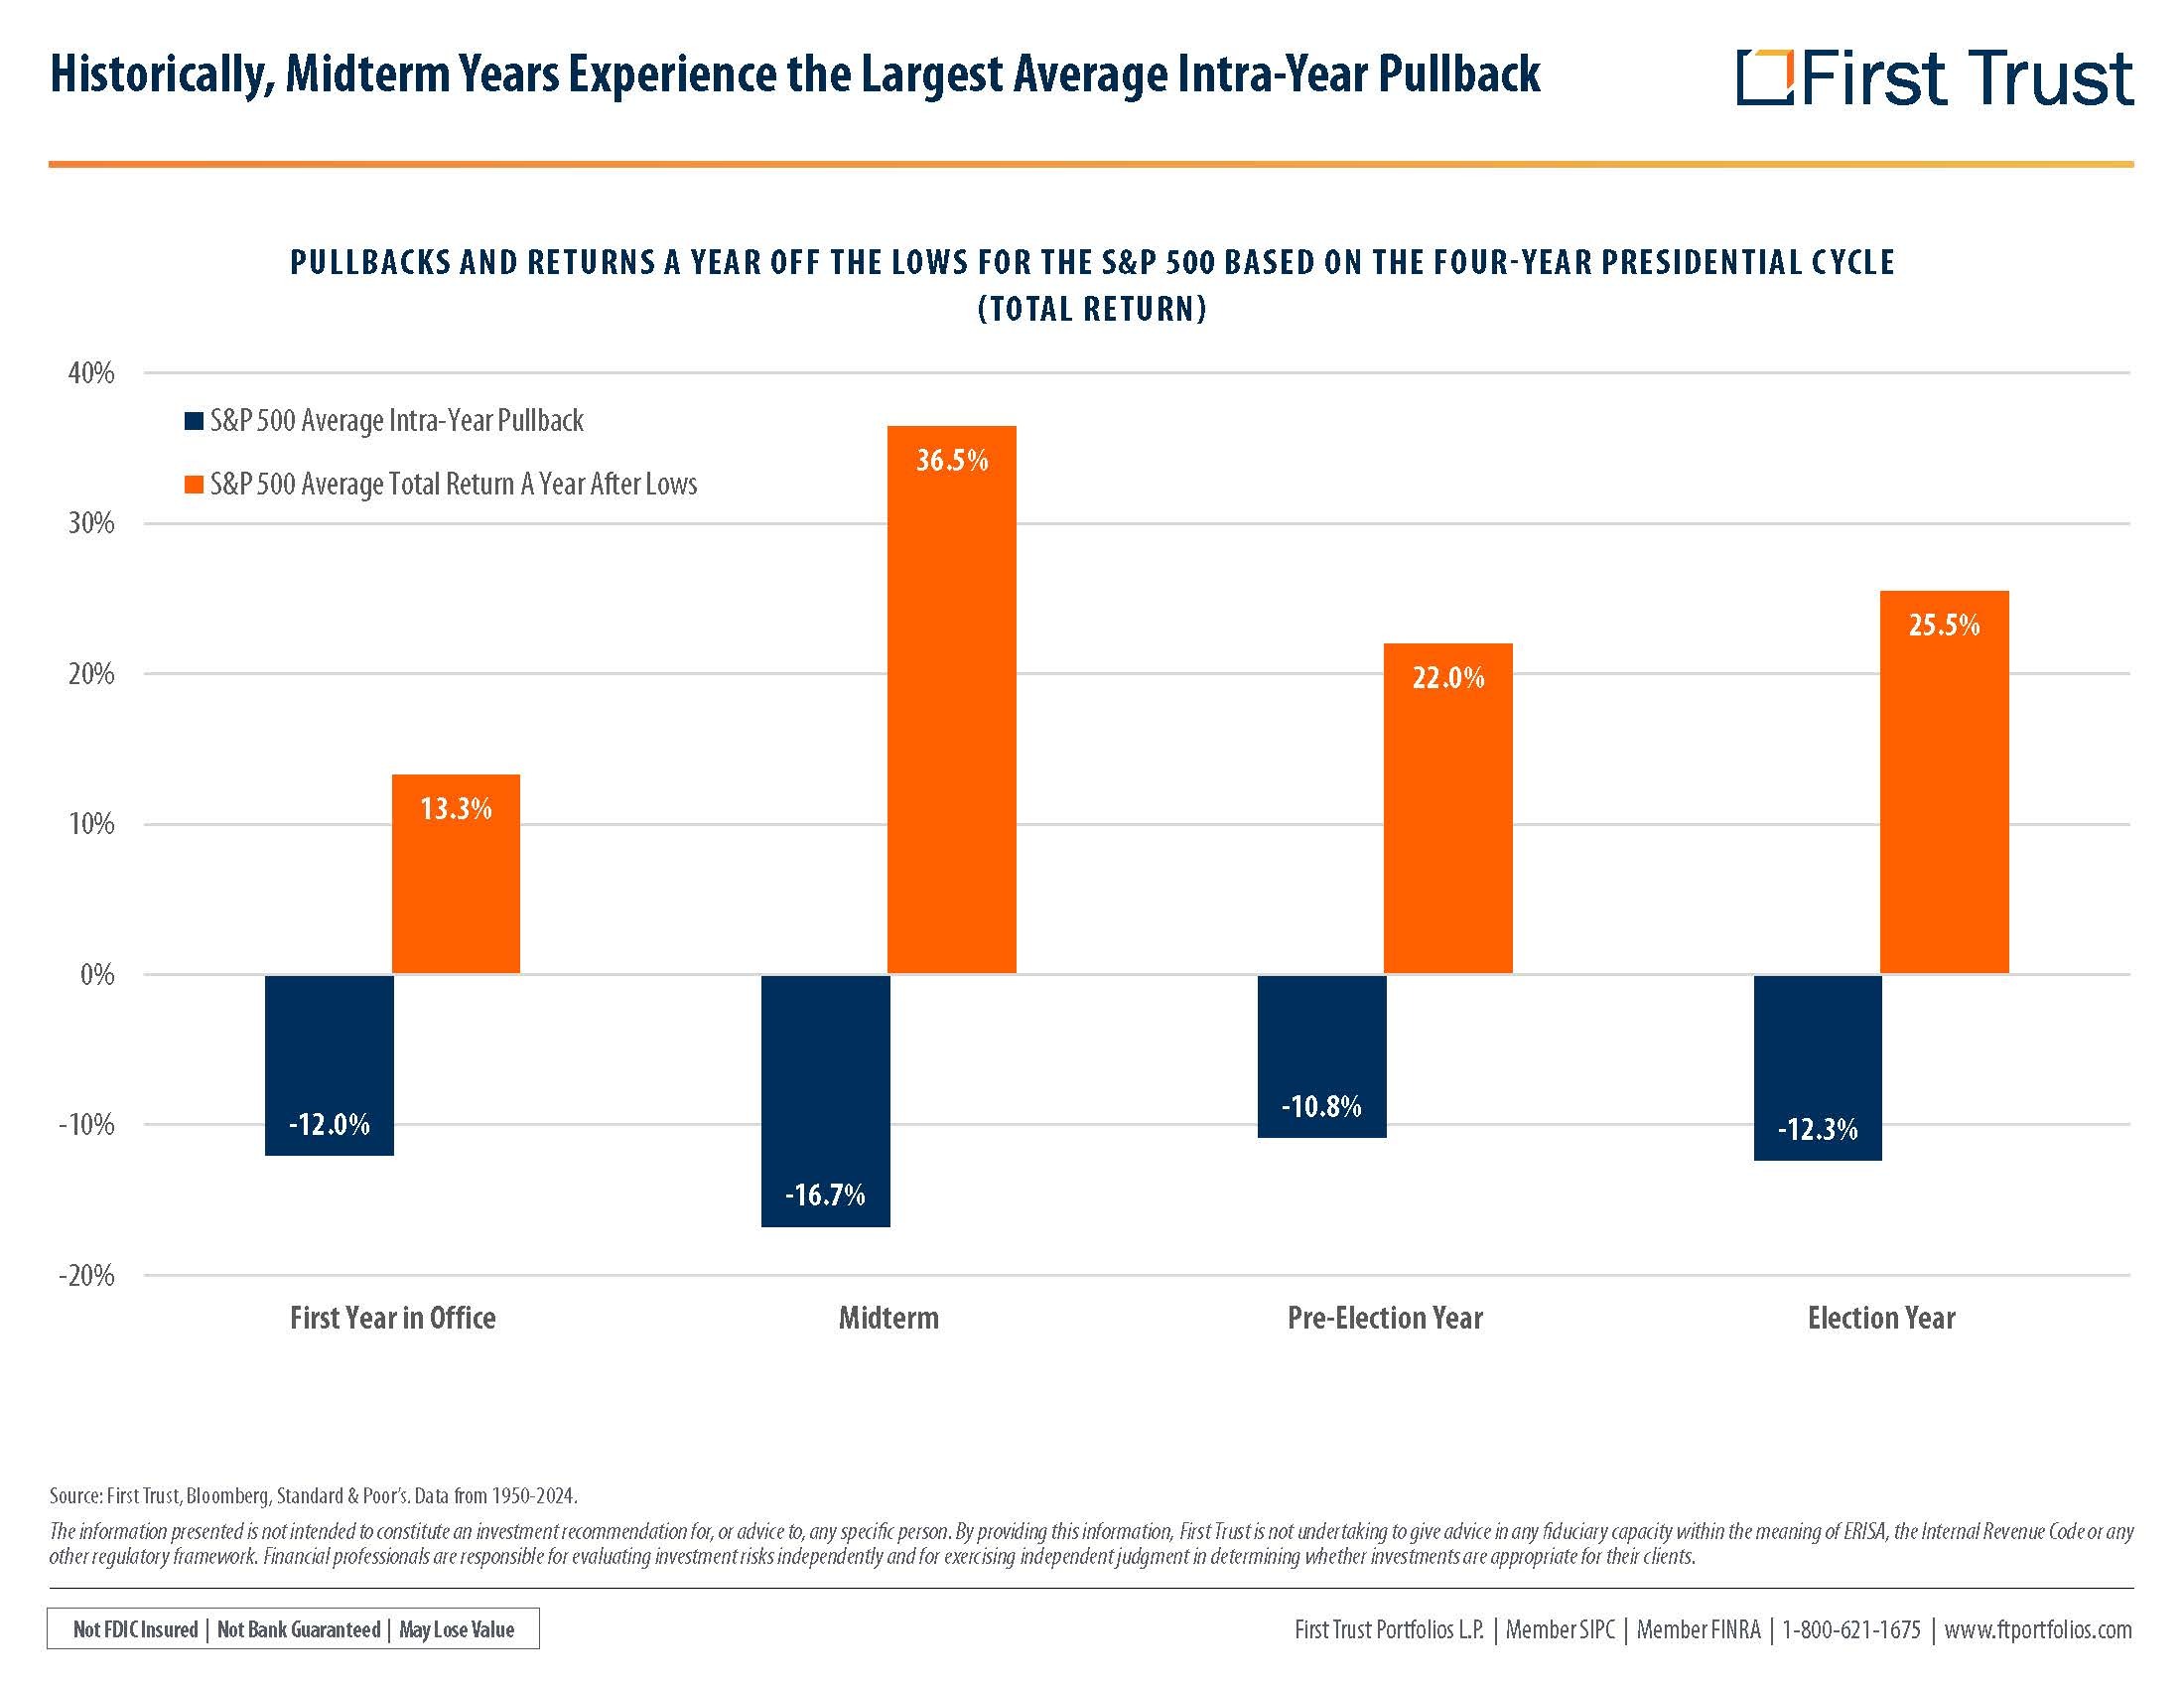
The average return one year after election day (blue bars) was 18.8%. Looking at the data from a slightly different angle, measuring from the low point of the year, the average return over the following twelve months was 36.5%. The median was 37.5%.
Let that sink in for a moment. The same years that rattled investors the most were followed by some of the strongest recoveries on record. Point being that midterm year drawdowns have historically rewarded dip-buyers handsomely.
Why This Happens
Nobody can say with certainty why markets behave this way, but the pattern is remarkably consistent. Markets hate uncertainty. Election seasons manufacture uncertainty in bulk. The rhetoric heats up, the ads flood the airwaves, and every news channel has a reason to make you feel like the republic hangs in the balance.
Once the votes are counted, the uncertainty lifts. Not because the problems disappear, but because the market can finally price in what it knows instead of what it fears. The volatility that built up during the campaign gets released, and historically that release has been upward.
The quarterly data backs this up. During midterm election years, the fourth quarter (October through December) has averaged a 7.6% return for the S&P 500. In non-election years, that same quarter averages 4.2%. The first quarter after a midterm has averaged 8.2%, compared to just 1.1% in non-election periods.
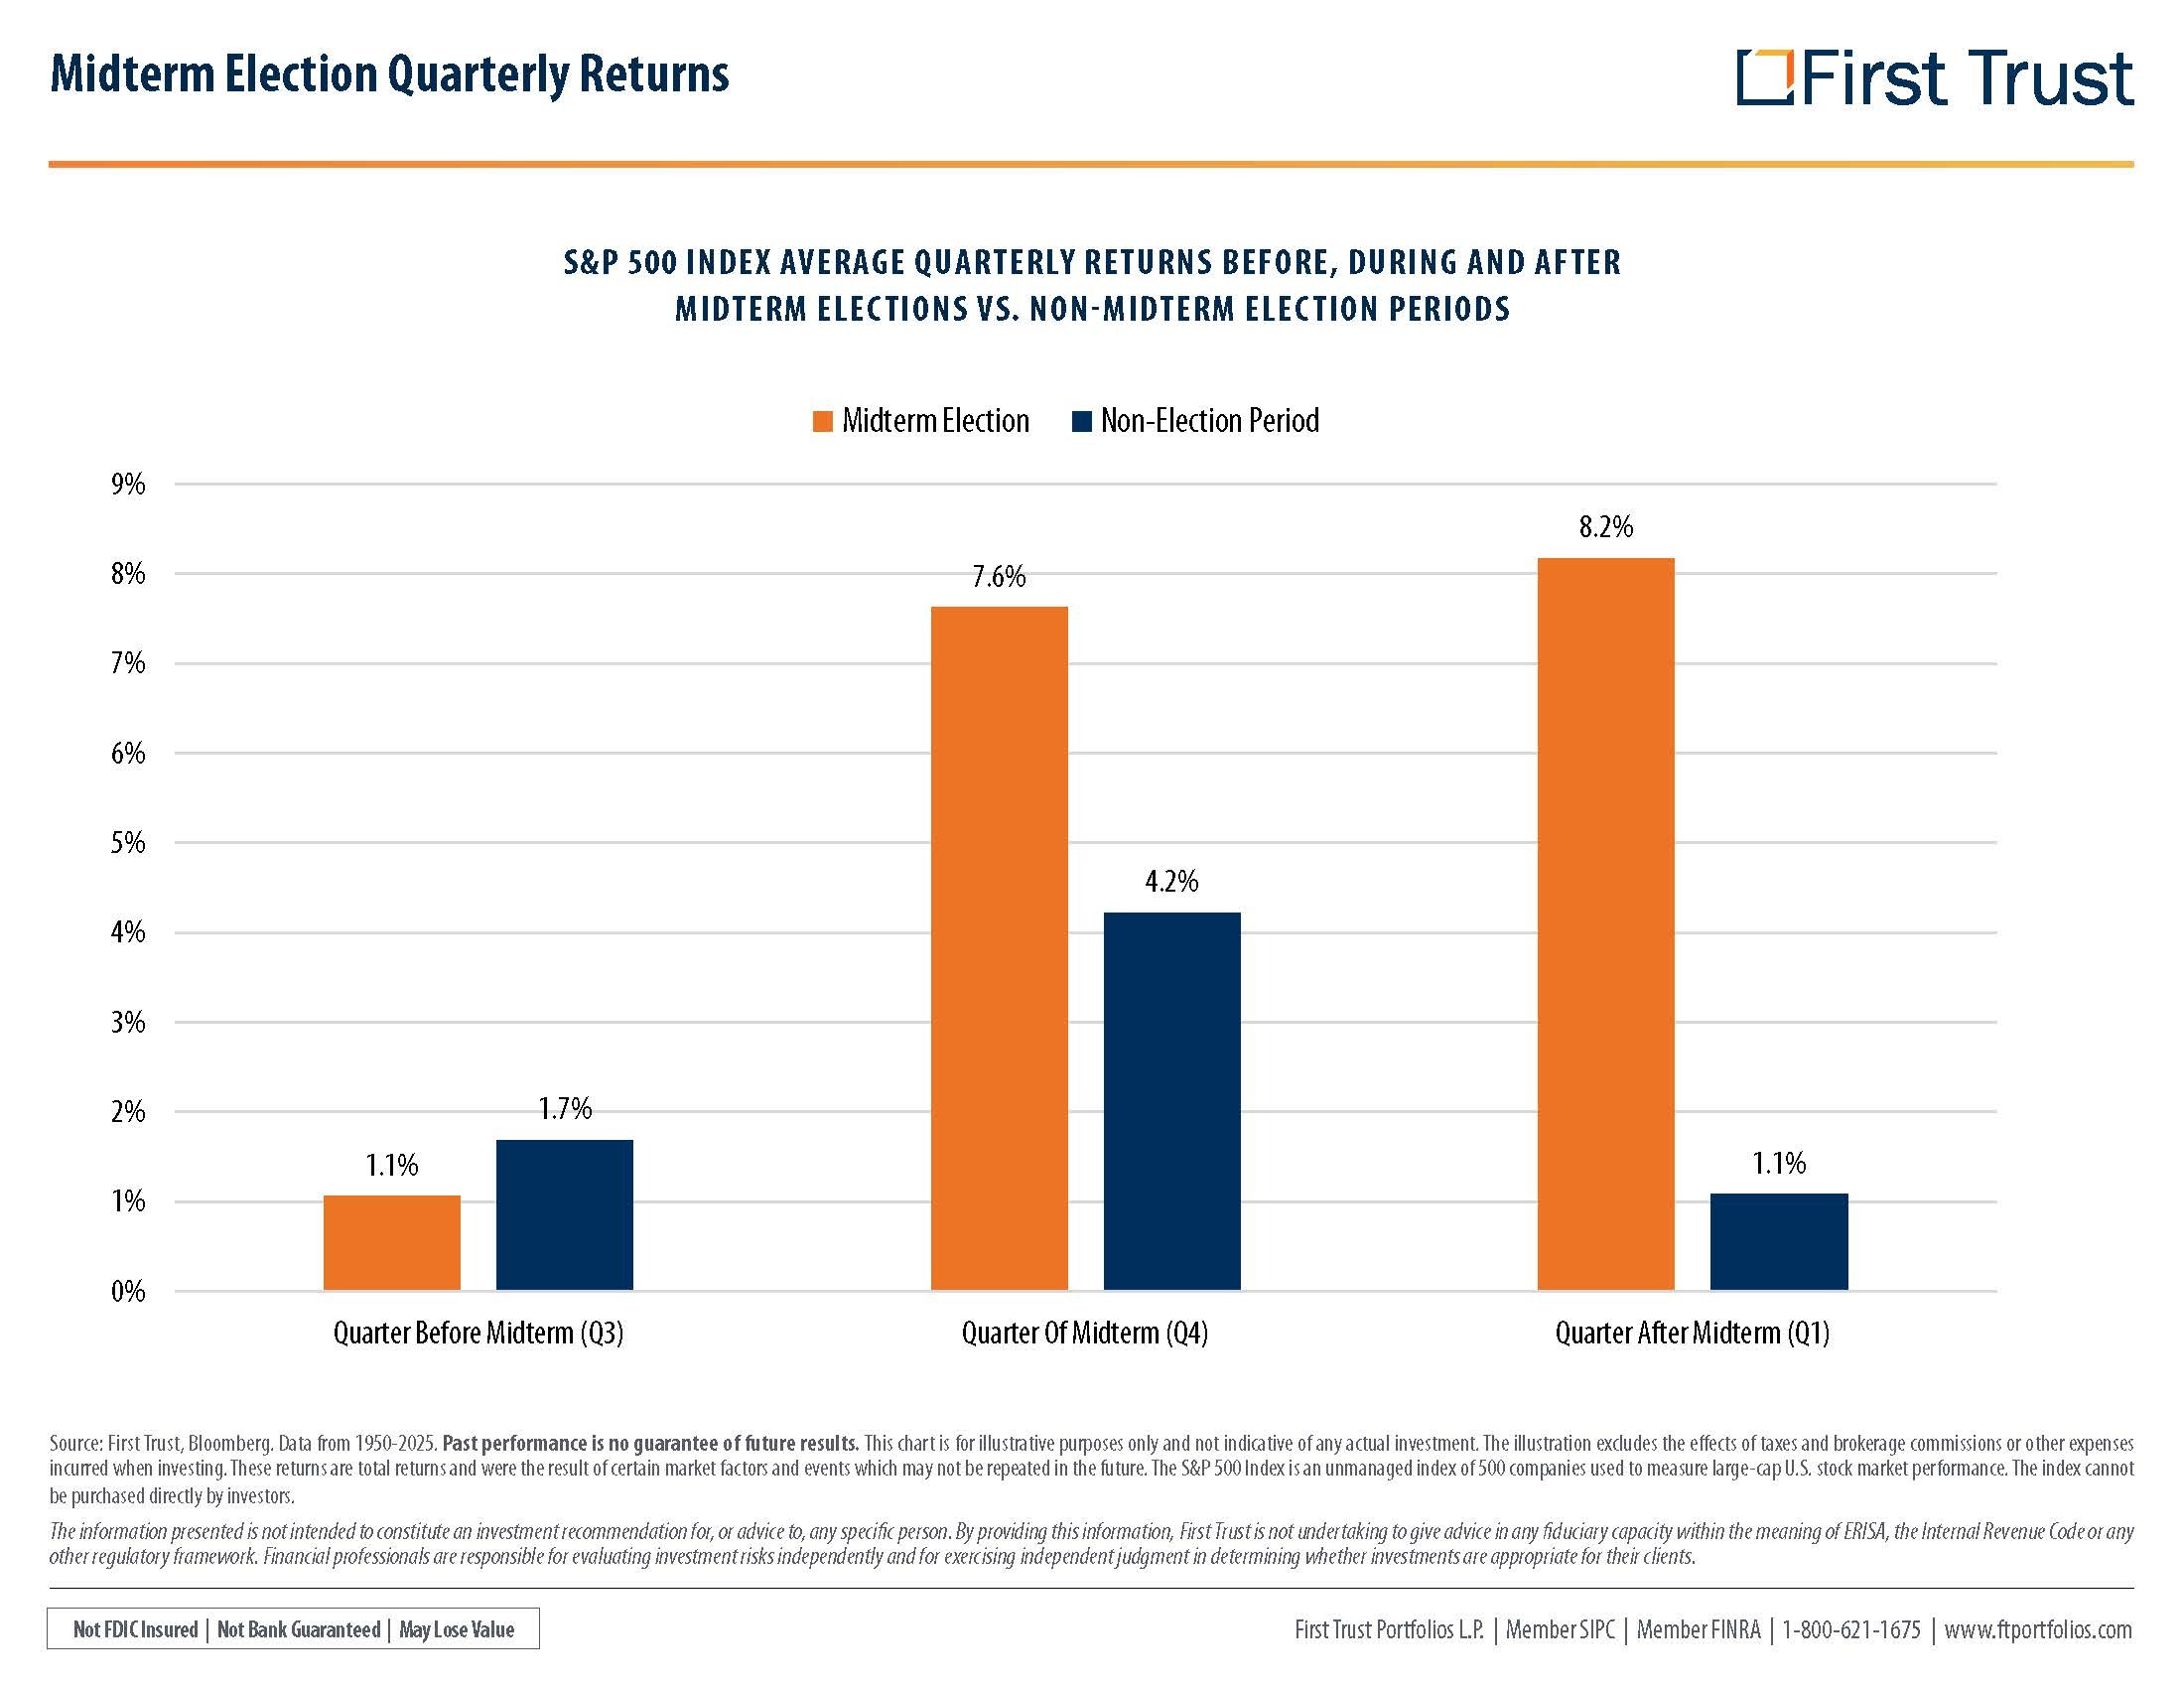
That's not a subtle difference. That's the market exhaling.
What This Means for You
You're 65. You've got roughly a million dollars saved. You probably worked 30 or 40 years to get there. The idea of watching 16% of it disappear in a single year is enough to make anyone want to call their advisor and say "get me out."
We understand that feeling. We've sat across the table from people who felt it. But the data is clear about what happens next.
The clients we've seen struggle the most over the years are the ones who let politics drive their investment decisions. They liked a particular president, so they bought stocks. They didn't like the next one, so they sold. They watched cable news and let the outrage of the day override a plan that was built for decades.
Almost universally, those people ended up worse off than the ones who stuck with their plan.
The Real Question
The question was never about who occupies the White House or which party controls Congress. The question is whether your plan was built correctly in the first place.
A well-constructed retirement plan accounts for volatility. It assumes there will be years that test your patience. It holds enough in safe assets to cover your spending needs without forcing you to sell stocks at a loss during a downturn. It positions your equity allocation to capture the recovery when it comes, because historically it always does.
When you have that kind of foundation, an election is just another news cycle. You might not like the outcome. You might disagree with the policy direction. Those are perfectly valid feelings to have as a citizen. But as an investor, your job is to stay in your seat.
Bottom Line
We're not telling you to stop caring about politics. Vote. Stay informed. Have opinions. That's your right and your responsibility.
What we're telling you is that the market has been through 19 midterm elections since 1950. It has been through wars, recessions, scandals, pandemics, and political upheavals that felt existential at the time. The S&P 500 still went from around 20 in 1950 to where it sits today.
The people who benefited from that growth were the ones who didn't flinch. They didn't sell because they were angry about an election. They didn't pull back because the other side won. They trusted their plan and let time do the heavy lifting.
That's the same opportunity you have today. The headlines will tell you, “this time is different”. They say that every time. The data says otherwise.
Your plan was built for this. Let it work.
Disclosures
This material has been prepared for informational purposes only and should not be construed as a solicitation to effect, or attempt to effect, either transactions in securities or the rendering of personalized investment advice. This material is not intended to provide, and should not be relied on for tax, legal, investment, accounting, or other financial advice. You should consult your own tax, legal, financial, and accounting advisors before engaging in any transaction. Asset allocation and diversification do not guarantee a profit or protect against a loss. All references to potential future developments or outcomes are strictly the views and opinions of Richard W. Paul & Associates and in no way promise, guarantee, or seek to predict with any certainty what may or may not occur in various economies and investment markets. Past performance is not necessarily indicative of future performance.